|
x
|
Annual
Report
Pursuant
To
Section
13 Or
15(D) Of
The
Securities
Exchange
Act
Of 1934
For
the fiscal year ended February 28,
2010
|
|
¨
|
Transition
Report
Pursuant
To
Section
13 Or
15(D) Of
The
Securities
Exchange
Act Of 1934
|
|
Delaware
|
04-3651093
|
|
|
(State or other jurisdiction of
incorporation or organization)
|
(I.R.S. Employer
Identification No.)
|
|
|
6373 San Ignacio Avenue
San Jose, California
|
95119
|
|
|
(Address of principal executive offices)
|
(Zip Code)
|
|
|
Large
Accelerated Filer
|
¨
|
Accelerated
Filer
|
¨
|
|
Non-Accelerated
Filer
|
x
|
Smaller
reporting company
|
¨
|
|
Page
|
||
|
Forward
Looking Statements
|
3
|
|
|
Part
I
|
||
|
Item
1.
|
Business
|
3
|
|
Item
1A.
|
Risk
Factors
|
15
|
|
Item
1B.
|
Unresolved
Staff Comments
|
29
|
|
Item
2.
|
Properties
|
29
|
|
Item
3.
|
Legal
Proceedings
|
30
|
|
Item
4.
|
(Removed
and Reserved)
|
31
|
|
Part
II
|
||
|
Item
5.
|
Market
for Registrant’s Common Equity. Related Stockholder Matters and
Issuer Purchases of Equity Securities
|
32
|
|
Item
6.
|
Selected
Financial Data
|
36
|
|
Item
7.
|
Management’s
Discussion and Analysis of Financial Condition and Results of
Operations
|
37
|
|
Item
7A.
|
Quantitative
and Qualitative Disclosures about Market Risk
|
48
|
|
Item
8.
|
Financial
Statements and Supplementary Data
|
49
|
|
Item
9.
|
Changes
in and Disagreements with Accountants on Accounting and Financial
Disclosure
|
71
|
|
Item
9A(t).
|
Controls
and Procedures
|
71
|
|
Item
9B.
|
Other
Information
|
72
|
|
Part
III
|
||
|
Item
10.
|
Directors,
Executive Officers and Corporate Governance
|
73
|
|
Item
11.
|
Executive
Compensation
|
78
|
|
Item
12.
|
Security
Ownership of Certain Beneficial Owners and Management and Related
Stockholder Matters
|
91
|
|
Item
13.
|
Certain
Relationships and Related Transactions, and Director
Independence
|
92
|
|
Item
14
|
Principal
Accounting Fees and Services
|
93
|
|
Item
15
|
Exhibits,
Financial Statement Schedules
|
94
|
|
Part
IV
|
||
|
Signatures
|
95
|
|
|
Item
1.
|
Business
|
|
|
§
|
Amazon.com;
|
|
|
§
|
ASK
Corporation;
|
|
|
§
|
BAS
Group;
|
|
|
§
|
D&H
Distribution Company;
|
|
|
§
|
Maxcom
Memory GmbH;
|
|
|
§
|
Memoryworld
GmbH & Co., KG;
|
|
|
§
|
Micro
Center Corporation;
|
|
|
§
|
Micro
Peripherals LTD;
|
|
|
§
|
NewEgg.com,
operated by Magnell Associate Inc.;
and
|
|
|
§
|
SYX
Distribution, Inc.
|
|
|
§
|
industrial
equipment and computer systems;
|
|
|
§
|
computer
and computer gaming and
enthusiasts;
|
|
|
§
|
mission
critical servers and high end
workstations;
|
|
|
§
|
personal
computer (“PC”)
upgrades to extend the useable life of existing
PCs;
|
|
|
§
|
high
performance computing and scientific
computing;
|
|
|
§
|
video
and music editing;
|
|
|
§
|
home
theatre PCs and digital home convergence products;
and
|
|
|
§
|
digital
photography and digital image manipulation
computers.
|
|
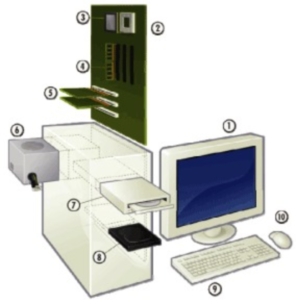
1.
|
Visual
Display Unit (Monitor)
|
|
2.
|
Motherboard
|
|
3.
|
Central
Processing Unit (CPU)
|
|
4.
|
Memory
|
|
5.
|
Graphics
Processing Unit (Video Card)
|
|
6.
|
Power
Supply and Chassis
|
|
7.
|
Optical
Drive (DVD-ROM, DVD Writer,
Blue-Ray)
|
|
8.
|
Storage
Drive (Traditional Hard Drive or Solid State
Drive)
|
|
9.
|
Keyboard
|
|
10.
|
Mouse
|
|
|
§
|
faster
start-up because, unlike HDDs, there is no spinning
disk;
|
|
|
§
|
at
least 10x faster than HDDs, allowing quicker access to the stored data,
because no read/write head is
required;
|
|
|
§
|
high
mechanical reliability and durability due to lack of moving
parts;
|
|
|
§
|
far
more resistant to the failure due to shock, high altitude, vibration,
humidity, and extreme temperature;
|
|
|
§
|
less
failure while writing or erasing data, which translates into lower chance
of irrecoverable data damage; and
|
|
|
§
|
require
less power to operate and generate less heat than that of conventional
hard disk drives, resulting in decreased power consumption specifically in
data centers, which reduces operating costs significantly for data center
operators. The reduced power consumption also makes SSDs ideal
for use in laptop computers and appliances where battery life is a
consideration.
|

|
|
§
|
enterprise
storage and video-on-demand (VoD)
applications;
|
|
|
§
|
military
and industrial applications;
|
|
|
§
|
servers
and workstations;
|
|
|
§
|
portable,
ULPC and desktop PCs; and
|
|
|
§
|
consumer
related markets.
|
|
|
§
|
increase
our penetration of the international consumer electronics and OEM markets
by expanding our sales and marketing
efforts;
|
|
|
§
|
expand
and broaden our product line by leveraging our technology and design
expertise;
|
|
|
§
|
build
strong supplier relationships with our primary component
vendors;
|
|
|
§
|
identify
new applications and customers for our
technology;
|
|
|
§
|
increase
our manufacturing efficiencies; and
|
|
|
§
|
pursue
acquisitions of complementary businesses and
technologies.
|
|
Product
|
Density
|
Features
|
Applications
|
|||
|
MLC-
Based Solid State Disk Drives
|
Up
to 2TB
|
Low
power consumption Read/write speeds up to 1.3GB/s
|
Mobile
computing, PCs, RAID controllers
|
|||
|
SLC-Based
Solid State Disk Drives
|
Up
to 512GB
|
Low
power consumption Read/write speeds up to 1.3GB/s, Lower
latency
|
Enterprise,
Servers, workstations, storage area networks, high performance
computing
|
|||
|
USB
Key Drives
|
128MB
-64GB
|
18MB
per second read/write
|
Mobile
computing, PCs
|
|||
|
Normal
and High Capacity SD and Micro SD Cards
|
128MB-16GB
|
Speeds
up to 25Mbs
|
Notebooks,
networking, communications,
photography
|
|||
|
DDR3
|
Density
|
Speed (MHz)
|
Applications
|
|||
|
High
Speed / Low Latency DIMMs
|
512MB-8GB
|
533-2133Mhz
|
Overclocking,
gaming, home theater, 3d modeling and audio/video editing computers and
workstations
|
|||
|
High
Speed / Low Latency SODIMMs
|
256MB-4GB
|
533-1600Mhz
|
High
performance notebooks, sub-notebooks
|
|||
|
Industry
Standard Unbuffered DIMM
|
256MB-4GB
|
400-1600Mhz
|
PCs
|
|||
|
Registered
DIMMs
|
512MB-8GB
|
400/533/667
|
Servers,
workstations, storage area networks, high performance
computing
|
|||
|
Industry
Standard SODIMMs
|
256MB-4GB
|
533/667
|
Notebooks,
sub-notebooks
|
|||
|
Product
|
Density
|
Features
|
Applications
|
|||
|
High
Wattage Power Supplies
|
Up
to 1200 watts
|
50
C operation, 80%+ efficiency and 1% load regulation, multiple
formats
|
OEM
applications servers, workstations, storage area networks, high
performance computing
|
|||
|
Low
Noise Power Supplies
|
Up
to 750 watts
|
Low
audible noise
|
Overclocking,
PCs and video/audio workstations
|
|||
|
Modular
PSUs
|
Up
to 1000 watts
|
Removable
reconfigurable cables
|
End-user
upgrades, gaming computers and home theater PCs
|
|||
|
High
Efficiency PSUs
|
Up
to 1000 watts
|
Green
friendly with 85% plus efficiency
|
End-user
upgrades, gaming computers and home theater
PCs
|
|||
|
|
§
|
specialized
solid state storage makers such as STEC, Inc., Fusion I/O and Mtron
Storage Technology Co., Ltd.;
|
|
|
§
|
global
technology vendors such as Intel Corporation and Samsung Electronics Co.,
Ltd.;
|
|
|
§
|
specialized
memory module and flash product vendors such as Kingston Technology
Corporation, SanDisk Corporation, Crucial Technology, the consumer brand
of Micron Technology, Inc., and Corsair Memory, Inc.;
and
|
|
|
§
|
specialized
power supply chassis and cooling manufacturers such as Antec, Inc.,
Thermaltake Technology Inc. USA and Enermax Technology
Corporation.
|
|
|
§
|
first
to market with new emerging
technologies;
|
|
|
§
|
flexible
and customizable products to fit customers’
objectives;
|
|
|
§
|
high
product performance reliability;
|
|
|
§
|
early
identification of emerging
opportunities;
|
|
|
§
|
cost-effectiveness;
|
|
|
§
|
interoperability
of products;
|
|
|
§
|
scalability;
and
|
|
|
§
|
localized
and responsive customer support on a worldwide
basis.
|
|
Item
1A.
|
Risk
Factors
|
|
|
§
|
lower
than anticipated sales and
profitability;
|
|
|
§
|
problems
integrating the purchased operations, technologies or
products;
|
|
|
§
|
costs
associated with the acquisition;
|
|
|
§
|
negative
effects on profitability resulting from the
acquisition;
|
|
|
§
|
adverse
effects on existing business relationships with suppliers and
customers;
|
|
|
§
|
risks
associated with entering markets in which we have no or limited prior
experience;
|
|
|
§
|
loss
of key employees of the acquired business;
and
|
|
|
§
|
litigation
arising from the acquired company’s operations before the
acquisition.
|
|
|
§
|
prevent
our competitors from independently developing similar products,
duplicating our products or designing around the patents owned by
us;
|
|
|
§
|
prevent
third-party patents from having an adverse effect on our ability to do
business;
|
|
|
§
|
provide
adequate protection for our intellectual property
rights;
|
|
|
§
|
prevent
disputes with third parties regarding ownership of our intellectual
property rights;
|
|
|
§
|
prevent
disclosure of our trade secrets and know-how to third parties or into the
public domain;
|
|
|
§
|
prevent
the challenge, invalidation or circumvention of our existing
patents;
|
|
|
§
|
result
in patents that lead to commercially viable products or provide
competitive advantages for our products;
and
|
|
|
§
|
result
in issued patents and registered trademarks from any of our pending
applications.
|
|
|
§
|
it
may limit our ability to service all of our debt
obligations;
|
|
|
§
|
it
may impair our ability to incur additional indebtedness or obtain
additional financing in the future for working capital, capital
expenditures, acquisitions, general corporate purposes or other
purposes;
|
|
|
§
|
some
of our debt is and will continue to be at variable rates of interest,
which may result in higher interest expense in the event of increases in
interest rates;
|
|
|
§
|
our
debt agreements contain, and any agreements to refinance our debt likely
will contain, financial and restrictive covenants, and our failure to
comply with them may result in an event of default which, if not cured or
waived, could have a material adverse effect on
us;
|
|
|
§
|
our
level of indebtedness will increase our vulnerability to general economic
downturns and adverse industry
conditions;
|
|
|
§
|
our
debt service obligations could limit our flexibility in planning for, or
reacting to, changes in our business and our industry;
and
|
|
|
§
|
it may limit our ability to
engage in certain transactions or capitalize on acquisition or other
business opportunities.
|
|
|
§
|
actual
or anticipated variations in quarterly operating
results;
|
|
|
§
|
changes
in financial estimates by us or by any securities analysts who might cover
our stock, or our failure to meet the estimates made by securities
analysts;
|
|
|
§
|
changes
in the market valuations of other companies operating in our
industry;
|
|
|
§
|
announcements
by us or our competitors of significant acquisitions, strategic
partnerships or divestitures;
|
|
|
§
|
additions
or departures of key personnel; and
|
|
|
§
|
a general downturn in the stock
market.
|
|
|
§
|
the
timing and volume of orders from our
customers;
|
|
|
§
|
the
rate of acceptance of our products by our customers, including the
acceptance of design wins;
|
|
|
§
|
the
demand for and life cycles of the products incorporating our
products;
|
|
|
§
|
the
rate of adoption of our products in the end markets we
target;
|
|
|
§
|
cancellations
or deferrals of customer orders in anticipation of new products or product
enhancements from us or our competitors or other
providers;
|
|
|
§
|
changes
in product mix; and
|
|
|
§
|
the
rate at which new markets emerge for products we are currently developing
or for which our design expertise can be utilized to develop products for
these new markets.
|
|
Property
|
Square Feet
|
Lease Expiration
|
Property Uses
|
|||
|
6373
San Ignacio Avenue
|
41,000
|
July
31, 2011
|
-Corporate
Headquarters
|
|||
|
San
Jose, California, USA
|
-General,
administrative, sales and
marketing
office
|
|||||
|
-Research
and Development
|
||||||
|
-Warehouse
|
||||||
|
160
Konrad Crescent, Unit #1,
|
3,375
|
June
30, 2010
|
-Sales
and marketing office
|
|||
|
Markham,
Ontario, Canada
|
-Warehouse
|
|||||
|
Kleveringweg
23, Unit 6
|
3,229
|
May
31, 2010
|
-Sales
and marketing office
|
|||
|
Delft,
The Netherlands
|
-Warehouse
|
|||||
|
16F-3,
No. 700, Chung Cheng
|
2,334
|
August
31, 2011
|
-Sales
and marketing office
|
|||
|
Road
|
-Research
and Development
|
|||||
|
Chung
Ho City, Taipei County
|
-Purchasing
|
|||||
|
Taiwan,
235, RoC
|
||||||
|
No. 165,
Changrong Road,
|
40,920
|
June
15, 2011
|
-Research
and Development
|
|||
|
Lujhu
Township, Taiwan RoC
|
-Manufacturing
|
|||||
|
-Warehouse
|
||||||
|
5995
Avenida Encinas, Suite 101
|
13,031
|
March
31, 2012
|
-Research
and Development
|
|||
|
Carlsbad,
California, USA
|
-Warehouse
|
|
Item 5.
|
Market
for Registrant’s Common
Equity. Related Stockholder Matters and Issuer Purchases of
Equity Securities
|
|
The
NASDAQ Capital Market
|
||||||||
|
High
|
Low
|
|||||||
|
2010:
|
||||||||
|
Period
of April 23 – May 14, 2010
|
$ | 5.05 | $ | 3.75 | ||||
|
OTCBB
|
||||||||
|
High
|
Low
|
|||||||
|
2010:
|
||||||||
|
Period
of March 1 – April 22, 2010
|
$ | 6.00 | $ | 3.95 | ||||
|
Period
of January 14 – February 28, 2010
|
$ | 6.25 | $ | 5.25 | ||||
|
AIM
|
||||||||
|
High
|
Low
|
|||||||
|
2009:
|
||||||||
|
Period
of March 1 – April 1, 2009
|
$ | 0.36 | $ | 0.12 | ||||
|
4th
Quarter (February 28, 2009)
|
$ | 0.51 | $ | 0.11 | ||||
|
2008:
|
||||||||
|
3rd
Quarter (November 30, 2008)
|
$ | 0.65 | $ | 0.38 | ||||
|
2nd Quarter
(August 31, 2008)
|
$ | 1.25 | $ | 0.75 | ||||
|
1st Quarter
(May 31, 2008)
|
$ | 1.88 | $ | 0.90 | ||||
|
2
Month Period Ended February 29, 2008
|
$ | 2.28 | $ | 1.48 | ||||
|
2007:
|
||||||||
|
4th
Quarter (December 31, 2007)
|
$ | 7.28 | $ | 2.10 | ||||
|
3rd
Quarter (September 30, 2007)
|
$ | 9.72 | $ | 6.00 | ||||
|
2nd Quarter
(June 30, 2007)
|
$ | 8.78 | $ | 5.65 | ||||
|
Plan Category
|
Number of securities
to be issued upon
exercise of
outstanding options,
warrants and rights
|
Weighted-average
exercise price of
outstanding
options, warrants
and rights
|
Number of
securities
remaining
available for
future
issuance
under equity
compensation
plans
|
|||||||||
|
Equity
compensation plans approved by security holders
|
2,779,111 | $ | 2.20 | 1,659,614 | ||||||||
|
Equity
compensation plans not approved by security holders
|
- | - | - | |||||||||
|
Totals
|
2,779,111 | $ | 2.20 | 1,659,614 | ||||||||
|
Years Ended
February 28/29,
|
Years Ended
December 31,
|
Two months
Ended February 28,
|
||||||||||||||||||||||||||
|
2010
|
2009
|
2008
|
2006
|
2005
|
2007
|
2006
|
||||||||||||||||||||||
|
(in thousands, except per share data)
|
(unaudited)
|
|||||||||||||||||||||||||||
|
Statement
of Operations Data:
|
||||||||||||||||||||||||||||
|
Revenue
|
$ | 143,959 | $ | 155,982 | $ | 118,352 | $ | 67,772 | $ | 35,718 | $ | 16,335 | $ | 8,310 | ||||||||||||||
|
Cost
of Revenue
|
125,303 | 136,191 | 95,419 | 58,826 | 29,493 | 13,153 | 7,117 | |||||||||||||||||||||
|
Gross
profit
|
18,656 | 19,791 | 22,933 | 8,946 | 6,225 | 3,182 | 1,193 | |||||||||||||||||||||
|
Operating
Expenses:
|
||||||||||||||||||||||||||||
|
Sales
and marketing
|
10,249 | 11,401 | 9,125 | 4,735 | 3,059 | 1,136 | 542 | |||||||||||||||||||||
|
Research
and development
|
5,331 | 2,575 | 1,570 | 452 | 232 | 202 | 52 | |||||||||||||||||||||
|
General
and administrative
|
14,711 | 16,709 | 11,704 | 5,006 | 3,067 | 1,212 | 573 | |||||||||||||||||||||
|
Impairment
of goodwill and intangible assets
|
911 | - | - | - | - | - | - | |||||||||||||||||||||
|
Total
operating expenses
|
31,202 | 30,685 | 23,399 | 10,193 | 6,358 | 2,550 | 1,167 | |||||||||||||||||||||
|
Income
(loss) from operations
|
(12,546 | ) | (10,894 | ) | 534 | (1,247 | ) | (133 | ) | 632 | 26 | |||||||||||||||||
|
Other
income and expense:
|
||||||||||||||||||||||||||||
|
Other
(expense) income
|
727 | (169 | ) | 256 | (30 | ) | 4 | (5 | ) | - | ||||||||||||||||||
|
Interest
and financing expense
|
(1,716 | ) | (600 | ) | (289 | ) | (682 | ) | (570 | ) | (51 | ) | (165 | ) | ||||||||||||||
|
Interest
and other income (expense), net
|
(989 | ) | (769 | ) | (33 | ) | (712 | ) | (566 | ) | 56 | (165 | ) | |||||||||||||||
|
Income
(loss) before income taxes
|
(13, 535 | ) | (11,663 | ) | 501 | (1,959 | ) | (699 | ) | 576 | (139 | ) | ||||||||||||||||
|
Income
tax expense (benefit)
|
(1 | ) | 61 | (936 | ) | (120 | ) | (110 | ) | 196 | (9 | ) | ||||||||||||||||
|
Net
income (loss)
|
$ | (13,534 | ) | $ | (11,724 | ) | $ | 1,437 | $ | (1,839 | ) | $ | (589 | ) | $ | 380 | $ | (130 | ) | |||||||||
|
Income
(loss) per share attributable to common stockholders:
|
||||||||||||||||||||||||||||
|
Basic
|
$ | (0.64 | ) | $ | (0.56 | ) | $ | 0.07 | $ | (0.12 | ) | $ | (0.14 | ) | ||||||||||||||
|
Diluted
|
$ | (0.64 | ) | $ | (0.56 | ) | $ | 0.07 | $ | (0.12 | ) | $ | (0.14 | ) | ||||||||||||||
|
Common
shares and equivalents outstanding:
|
||||||||||||||||||||||||||||
|
Basic
weighted average shares
|
21,300 | 21,000 | 19,800 | 15,400 | 4,200 | |||||||||||||||||||||||
|
Diluted
weighted average shares
|
21,300 | 21,000 | 20,400 | 15,400 | 4,200 | |||||||||||||||||||||||
|
Balance
Sheet Data:
|
||||||||||||||||||||||||||||
|
Cash
and cash equivalents
|
$ | 1,224 | $ | 420 | $ | 1,544 | $ | 1,423 | $ | 120 | ||||||||||||||||||
|
Total
assets
|
47,849 | 57,703 | 52,947 | 19,358 | 3,567 | |||||||||||||||||||||||
|
Deferred
revenue
|
95 | 167 | 92 | 89 | 61 | |||||||||||||||||||||||
|
Notes
payable, capital lease obligation, long term deferred rent
|
532 | 200 | 575 | - | 317 | |||||||||||||||||||||||
|
Total
stockholders’ equity
|
$ | 6,288 | $ | 18,923 | $ | 29,798 | $ | 9,026 | $ | 556 | ||||||||||||||||||
|
Item 7.
|
Management’s Discussion
and Analysis of Financial Condition and Results of Operations
|
|
|
§
|
Amazon.com;
|
|
|
§
|
ASK
Corporation;
|
|
|
§
|
BAS
Group;
|
|
|
§
|
D&H
Distribution Company;
|
|
|
§
|
Maxcom
Memory GmbH;
|
|
|
§
|
Memoryworld
GmbH & Co., KG;
|
|
|
§
|
Micro
Center Corporation;
|
|
|
§
|
Micro
Peripherals LTD;
|
|
|
§
|
NewEgg.com,
operated by Magnell Associate Inc.;
and
|
|
|
§
|
SYX
Distribution, Inc.
|
|
|
§
|
industrial
equipment and computer systems;
|
|
|
§
|
computer
and computer gaming and
enthusiasts;
|
|
|
§
|
mission
critical servers and high end
workstations;
|
|
|
§
|
personal
computer (“PC”)
upgrades to extend the useable life of existing
PCs;
|
|
|
§
|
high
performance computing and scientific
computing;
|
|
|
§
|
video
and music editing;
|
|
|
§
|
home
theatre PCs and digital home convergence products;
and
|
|
|
§
|
digital
photography and digital image manipulation
computers.
|
|
Year Ended
February 28/29,
|
||||||||||||
|
2010
|
2009
|
2008
|
||||||||||
|
(audited)
|
(audited)
|
(audited)
|
||||||||||
|
Revenue
|
||||||||||||
|
Sales
– net
|
100 | % | 100 | % | 100 | % | ||||||
|
Cost
of revenue
|
87.0 | 87.3 | 80.6 | |||||||||
|
Gross
Profit
|
13.0 | 12.7 | 19.4 | |||||||||
|
Expenses
|
||||||||||||
|
Sales
and marketing
|
7.1 | 7.3 | 7.7 | |||||||||
|
Research
and development
|
3.7 | 1.7 | 1.3 | |||||||||
|
General,
administrative and operations
|
10.3 | 10.7 | 9.9 | |||||||||
|
Impairment
of goodwill and intangible assets
|
0.6 | - | - | |||||||||
|
Total
operating expenses
|
21.7 | 19.7 | 18.9 | |||||||||
|
Operating
profit/(loss)
|
(8.7 | ) | (7.0 | ) | 0.5 | |||||||
|
Other
income/(expense)
|
||||||||||||
|
Other
income – net
|
0.5 | (0.1 | ) | 0.2 | ||||||||
|
Interest
and financing costs
|
(1.2 | ) | (0.4 | ) | (0.2 | ) | ||||||
|
Total
other income/(expense)
|
(0.7 | ) | (0.5 | ) | 0.0 | |||||||
|
Profit/(Loss)
before tax
|
(9.4 | ) | (7.5 | ) | 0.4 | |||||||
|
Tax
(expense) benefit
|
- | - | 0.8 | |||||||||
|
Net
profit/(loss)
|
(9.4 | )% | (7.5 | )% | 1.2 | % | ||||||
|
|
§
|
delivery
of monthly and annual financial
statements;
|
|
|
§
|
tax,
deposit account and insurance
requirements;
|
|
|
§
|
restrictions
on our ability to complete dispositions, debt incurrence, distributions,
investments, liens, mergers and acquisitions;
and
|
|
|
§
|
certain
financial covenants that are tested on a monthly
basis.
|
|
|
§
|
delivery
of monthly and annual financial
statements;
|
|
|
§
|
giving
notice if we have a material adverse change and under other circumstances;
and
|
|
|
§
|
restrictions
on our ability to complete dispositions, debt incurrence, distributions,
investments and other liens.
|
|
(in thousands)
|
Total
|
Less
than 1
year
|
1-3
years
|
3-5
years
|
More
than 5
years
|
|||||||||||||||
|
Long-term
debt obligations
|
$ | 500 | $ | 500 | $ | - | $ | - | $ | - | ||||||||||
|
Operating
lease obligations
|
$ | 1,002 | $ | 667 | $ | 335 | - | - | ||||||||||||
|
Total
|
$ | 1,502 | $ | 1,167 | $ | 335 | $ | - | $ | - | ||||||||||
|
Fiscal Year Ended
|
Fiscal Year Ended
|
Fiscal Year Ended
|
||||||||||
|
February 28, 2010
|
February 28, 2009
|
February 29, 2008
|
||||||||||
|
Expected
dividend
|
0 | % | 0 | % | 0 | % | ||||||
|
Risk
free interest rate
|
2.0 | % | 2.8 | % | 4.7 | % | ||||||
|
Expected
volatility
|
0.58 | 0.40 | 0.37 | |||||||||
|
Expected
life (in years)
|
4.28 | 4.24 | 4.28 | |||||||||
|
Item
7A.
|
Quantitative
and Qualitative Disclosures about Market
Risk
|
|
Item
8.
|
Financial
Statements and Supplementary Data
|
|
Index to Consolidated Financial Statements of OCZ
Technology Group, Inc.
|
|
|
Page
|
|
|
Reports
of Independent Registered Public Accountants
|
50
|
|
Consolidated
Statements of Operations
|
52
|
|
Consolidated
Balance Sheets
|
53
|
|
Consolidated
Statements of Stockholders’ Equity and Comprehensive Loss
|
54
|
|
Consolidated
Statements of Cash Flows
|
55
|
|
Notes
to Consolidated Financial Statements
|
56
|
|
Year Ended February 28/29
|
||||||||||||
|
2010
|
2009
|
2008
|
||||||||||
|
Net
revenues
|
$ | 143,959 | $ | 155,982 | $ | 118,352 | ||||||
|
Cost
of revenues
|
125,303 | 136,191 | 95,419 | |||||||||
|
Gross
profit
|
18,656 | 19,791 | 22,933 | |||||||||
|
Sales
and marketing
|
10,249 | 11,401 | 9,125 | |||||||||
|
Research
and development
|
5,331 | 2,575 | 1,570 | |||||||||
|
General,
administrative and operations
|
14,711 | 16,709 | 11,704 | |||||||||
|
Impairment
of goodwill and intangible assets
|
911 | - | - | |||||||||
|
Total
operating expenses
|
31,202 | 30,685 | 22,399 | |||||||||
|
Operating
income (loss)
|
(12,546 | ) | (10,894 | ) | 534 | |||||||
|
Other
income (expense) - net
|
727 | (169 | ) | 256 | ||||||||
|
Interest
and financing costs
|
(1,716 | ) | (600 | ) | (289 | ) | ||||||
|
Income
(loss) before income taxes
|
(13,535 | ) | (11,663 | ) | 501 | |||||||
|
Income
tax expense (benefit)
|
(1 | ) | 61 | (936 | ) | |||||||
|
Net
income (loss)
|
$ | (13,534 | ) | $ | (11,724 | ) | $ | 1,437 | ||||
|
Net
income (loss) per share:
|
||||||||||||
|
Basic
|
$ | (0.64 | ) | $ | (0.56 | ) | $ | 0.07 | ||||
|
Diluted
|
$ | (0.64 | ) | $ | (0.56 | ) | $ | 0.07 | ||||
|
Shares
used in per share computation:
|
||||||||||||
|
Basic
|
21,300 | 21,000 | 19,800 | |||||||||
|
Diluted
|
21,300 | 21,000 | 20,400 | |||||||||
|
February 28, 2010
|
February 28, 2009
|
|||||||
|
ASSETS
|
||||||||
|
Current
Assets:
|
||||||||
|
Cash
and cash equivalents
|
$ | 1,224 | $ | 420 | ||||
|
Accounts
receivable, net of allowances of $2,853 and $2,279
|
20,380 | 23,995 | ||||||
|
Inventory,
net
|
9,846 | 16,787 | ||||||
|
Note
receivable
|
375 | - | ||||||
|
Deferred
tax asset, net
|
836 | 836 | ||||||
|
Prepaid
expenses and other assets
|
1,811 | 2,112 | ||||||
|
Total
current assets
|
34,472 | 44,150 | ||||||
|
Property
and equipment, net
|
2,629 | 2,855 | ||||||
|
Intangible
assets
|
88 | 268 | ||||||
|
Goodwill
|
9,954 | 10,342 | ||||||
|
Investment
|
668 | - | ||||||
|
Other
assets
|
38 | 88 | ||||||
|
Total
assets
|
$ | 47,849 | $ | 57,703 | ||||
|
LIABILITIES
AND STOCKHOLDERS' EQUITY
|
||||||||
|
Current
liabilities:
|
||||||||
|
Loans
payable
|
$ | 10,354 | $ | 9,435 | ||||
|
Notes
payable
|
500 | 200 | ||||||
|
Accounts
payable
|
26,318 | 25,394 | ||||||
|
Accrued
and other liabilities
|
4,389 | 3,751 | ||||||
|
Total
liabilities
|
41,561 | 38,780 | ||||||
|
Commitments
and contingencies
|
||||||||
|
Stockholders’
equity:
|
||||||||
|
Preferred
stock, $0.0025 par value; 20,000,000 shares authorized, 60,990 shares
issued and outstanding as of February 28, 2010 (none at February 28,
2009)
|
- | - | ||||||
|
Common
stock, $0.0025 par value; 120,000,000 shares authorized, 21,278,643 shares
issued and outstanding as of February 28, 2010 and 100,000,000 shares
authorized, 21,278,643 shares issued and outstanding as of February 28,
2009
|
53 | 53 | ||||||
|
Additional
paid-in capital
|
31,862 | 30,911 | ||||||
|
Accumulated
translation adjustment
|
(164 | ) | (112 | ) | ||||
|
Accumulated
deficit
|
(25,463 | ) | (11,929 | ) | ||||
|
Total
stockholders' equity
|
6,288 | 18,923 | ||||||
|
Total
liabilities and stockholders' equity
|
$ | 47,849 | $ | 57,703 | ||||
|
Preferred Stock
|
Common Stock
|
|||||||||||||||||||||||||||||||
|
Shares
Number
|
Shares
Amount
|
Shares
Number
|
Shares
Amount
|
Additional
Paid-in Capital
|
Accumulated
Other
Comprehensive
Income (Loss)
|
Accumulated
Deficit
|
Total
|
|||||||||||||||||||||||||
|
As
at March 1, 2007
|
- | $ | - | 17,405 | $ | 44 | $ | 11,108 | $ | (135 | ) | $ | (1,642 | ) | $ | 9,375 | ||||||||||||||||
|
Components
of comprehensive income:
|
||||||||||||||||||||||||||||||||
|
Net
income
|
- | - | - | - | - | - | 1,437 | 1,437 | ||||||||||||||||||||||||
|
Foreign
currency translation adjustment
|
- | - | - | - | - | 290 | - | 290 | ||||||||||||||||||||||||
|
Total
comprehensive income
|
155 | (205 | ) | 1,727 | ||||||||||||||||||||||||||||
|
Issuance
of common stock for acquisition
|
- | - | 249 | 1 | 1,975 | - | - | 1,976 | ||||||||||||||||||||||||
|
Issuance
of common stock
|
- | - | 2,651 | 6 | 15,251 | - | - | 15,257 | ||||||||||||||||||||||||
|
Capitalization
of promissory note
|
- | - | 232 | - | 500 | - | - | 500 | ||||||||||||||||||||||||
|
Exercise
of stock options and warrants
|
- | - | 328 | 1 | 235 | - | - | 236 | ||||||||||||||||||||||||
|
Stock
based compensation
|
- | - | - | - | 772 | - | - | 772 | ||||||||||||||||||||||||
|
Tax
effect of stock based compensation
|
- | - | - | - | (45 | ) | - | - | (45 | ) | ||||||||||||||||||||||
|
As
at February 29, 2008
|
- | - | 20,865 | 52 | 29,796 | 155 | (205 | ) | 29,798 | |||||||||||||||||||||||
|
Components
of comprehensive income:
|
||||||||||||||||||||||||||||||||
|
Net
Loss
|
- | - | - | - | - | - | (11,724 | ) | (11,724 | ) | ||||||||||||||||||||||
|
Foreign
currency translation adjustment
|
- | - | - | - | - | (267 | ) | - | (267 | ) | ||||||||||||||||||||||
|
Total
comprehensive income
|
(112 | ) | (11,929 | ) | (11,991 | ) | ||||||||||||||||||||||||||
|
Exercise
of stock options
|
- | - | 74 | - | 35 | - | - | 35 | ||||||||||||||||||||||||
|
Capitalization
of promissory note
|
- | - | 339 | 1 | 199 | - | - | 200 | ||||||||||||||||||||||||
|
Stock
based compensation
|
- | - | - | - | 877 | - | - | 877 | ||||||||||||||||||||||||
|
Tax
effect of stock based compensation
|
- | - | - | - | 4 | - | - | 4 | ||||||||||||||||||||||||
|
As
at February 28, 2009
|
- | - | 21,278 | 53 | 30,911 | (112 | ) | (11,929 | ) | 18,923 | ||||||||||||||||||||||
|
Components
of comprehensive income:
|
||||||||||||||||||||||||||||||||
|
Net
Loss
|
- | - | - | - | - | - | (13,534 | ) | (13,534 | ) | ||||||||||||||||||||||
|
Foreign
currency translation adjustment
|
- | - | - | - | - | (52 | ) | (52 | ) | |||||||||||||||||||||||
|
Total
comprehensive income
|
(164 | ) | (25,463 | ) | (13,586 | ) | ||||||||||||||||||||||||||
|
Adjustment
of exercise of stock options
|
- | - | - | - | 7 | - | - | 7 | ||||||||||||||||||||||||
|
Issuance
of preferred stock
|
61 | - | - | - | 281 | - | - | 281 | ||||||||||||||||||||||||
|
Stock
based compensation
|
- | - | - | - | 663 | - | - | 663 | ||||||||||||||||||||||||
|
As
at February 28, 2010
|
61 | $ | - | 21,278 | $ | 53 | $ | 31,862 | $ | (164 | ) | $ | (25,463 | ) | $ | 6,288 | ||||||||||||||||
|
Year
Ended February 28/29
|
||||||||||||
|
2010
|
2009
|
2008
|
||||||||||
|
Cash
flows from operating activities:
|
||||||||||||
|
Net
income (loss)
|
$ | (13,534 | ) | $ | (11,724 | ) | $ | 1,437 | ||||
|
Adjustments
to reconcile net income/(loss) to net cash flows from operating
activities:
|
||||||||||||
|
Depreciation
of property and equipment
|
1,009 | 744 | 468 | |||||||||
|
Amortization
of intangibles
|
111 | 112 | 56 | |||||||||
|
Impairment
of goodwill and intangible assets
|
911 | - | - | |||||||||
|
Bad
debt expense
|
644 | 1,410 | 299 | |||||||||
|
Stock-based
compensation
|
663 | 877 | 772 | |||||||||
|
Non-cash
write-off of leasehold improvements
|
104 | - | - | |||||||||
|
Non-cash
gain on disposition of product line
|
(668 | ) | - | - | ||||||||
|
Changes
in operating assets and current liabilities:
|
||||||||||||
|
Accounts
receivable
|
2,971 | (4,925 | ) | (7,726 | ) | |||||||
|
Inventory
|
6,566 | (1,960 | ) | (10,550 | ) | |||||||
|
Prepaid
expenses and other assets
|
301 | 974 | (2,142 | ) | ||||||||
|
Accounts
payable
|
924 | 12,361 | 7,637 | |||||||||
|
Deferred
tax asset, net
|
(716 | ) | ||||||||||
|
Accrued
and other liabilities
|
638 | 1,110 | 519 | |||||||||
|
Net
cash provided by (used in) operating activities
|
640 | (1,021 | ) | (9,946 | ) | |||||||
|
Cash
flows from investing activities:
|
||||||||||||
|
Purchases
of property and equipment
|
(887 | ) | (1,659 | ) | (1,546 | ) | ||||||
|
Decrease
(increase) in deposits
|
50 | (23 | ) | 44 | ||||||||
|
Business
acquisition earn out payments
|
(454 | ) | (553 | ) | (7,729 | ) | ||||||
|
Net
cash used in investing activities
|
1,291 | (2,235 | ) | (9,231 | ) | |||||||
|
Cash
flows from financing activities:
|
||||||||||||
|
Issuance
of common stock
|
7 | 238 | 15,499 | |||||||||
|
Issuance
of preferred stock
|
281 | - | - | |||||||||
|
Proceeds
from bank loan, net
|
919 | 2,536 | 3,869 | |||||||||
|
Proceeds
from shareholder loan
|
500 | - | - | |||||||||
|
Proceeds
from (repayment of) notes payable
|
(200 | ) | (375 | ) | 575 | |||||||
|
Net
cash provided by financing activities
|
1,507 | 2,399 | 19,943 | |||||||||
|
Effect
of foreign exchange rate changes on cash and cash
equivalents
|
(52 | ) | (267 | ) | 388 | |||||||
|
Net
increase (decrease) in cash and cash equivalents
|
804 | (1,124 | ) | 1,154 | ||||||||
|
Cash
and cash equivalents at beginning of period
|
420 | 1,544 | 390 | |||||||||
|
Cash
and cash equivalents at end of period
|
$ | 1,224 | $ | 420 | $ | 1,544 | ||||||
|
Supplemental
disclosures:
|
||||||||||||
|
Interest
paid
|
$ | 823 | $ | 593 | $ | 285 | ||||||
|
Income
taxes paid
|
$ | - | $ | 60 | $ | - | ||||||
|
1.
|
History
|
|
2.
|
Summary
of significant accounting policies
|
|
Vehicles
|
3
years
|
|
Furniture
and fixtures
|
3 —
5 years
|
|
Equipment
|
3 —
5 years
|
|
Leasehold
improvements
|
Shorter
of term of lease or asset
life
|
|
|
§
|
Level
1: Financial assets and liabilities whose values are based on unadjusted
quoted market prices for identical assets and liabilities in an active
market that the Company has the ability to
access.
|
|
|
§
|
Level
2: Financial assets and liabilities whose values are based onquoted prices
in markets that are not active or model inputs that are observable for
substantially the full term of the asset or
liability.
|
|
|
§
|
Level
3: Financial assets and liabilities whose values are based onprices or
valuation techniques that require inputs that are both unobservable and
significant to the overall fair value
measurement.
|
|
Level
I
|
Level
II
|
Level
III
|
||||||||||
|
Note
Receivable
|
- | - | $ | 635,000 | ||||||||
|
Investment
|
- | - | $ | 408,000 | ||||||||
|
Fiscal Year Ended
|
Fiscal Year Ended
|
Fiscal Year Ended
|
||||||||||
|
February 28, 2010
|
February 28, 2009
|
February 29, 2008
|
||||||||||
|
Expected
dividend
|
0%
|
0%
|
0%
|
|||||||||
|
Risk
free interest rate
|
2.0%
|
2.8%
|
4.7%
|
|||||||||
|
Expected
volatility
|
0.58
|
0.40
|
0.37
|
|||||||||
|
Expected
life (in years)
|
4.28
|
4.24
|
4.28
|
|||||||||
|
3.
|
Recent
accounting pronouncements
|
|
4.
|
Inventory
|
|
February 28,
2010
(’000)
|
February 28,
2009
(’000)
|
|||||||
|
Raw
materials
|
$ | 3,246 | $ | 5,484 | ||||
|
Work
in progress
|
5,319 | 5,972 | ||||||
|
Finished
goods
|
1,281 | 5,331 | ||||||
| $ | 9,846 | $ | 16,787 | |||||
|
5.
|
Property
and equipment
|
|
February 28,
2010
(’000)
|
February 28,
2009
(’000)
|
|||||||
|
Vehicles
|
$ | 135 | $ | 135 | ||||
|
Furniture
and fixtures
|
38 | 154 | ||||||
|
Equipment
|
4,471 | 3,689 | ||||||
|
Leasehold
Improvements
|
439 | 414 | ||||||
| 5,083 | 4,392 | |||||||
|
Less: accumulated
depreciation
|
(2,454 | ) | (1,537 | ) | ||||
| $ | 2,629 | $ | 2,855 | |||||
|
6.
|
Goodwill
and other intangible assets
|
|
Goodwill
(’000)
|
Other
Intangible
assets
(’000)
|
|||||||
|
Cost
|
||||||||
|
As
at February 29, 2008
|
$ | 9,789 | $ | 446 | ||||
|
Additions
during the period for Goodwill contingent payment
|
553 | — | ||||||
|
As
at February 28, 2009
|
10,342 | 446 | ||||||
|
Additions
during the period for Goodwill contingent payment
|
454 | — | ||||||
|
As
at February 28, 2010
|
$ | 10,796 | $ | 446 | ||||
|
Accumulated
Amortization/Impairment
|
||||||||
|
As
at February 29, 2008
|
$ | — | $ | 66 | ||||
|
Amortization
for the period
|
— | 112 | ||||||
|
As
at February 28, 2009
|
— | 178 | ||||||
|
Amortization
for the period
|
— | 111 | ||||||
|
Impairment
|
842 | 69 | ||||||
|
As
at February 28, 2010
|
$ | 842 | $ | 358 | ||||
|
Net carrying value
|
||||||||
|
As
at February 28, 2009
|
$ | 10,342 | $ | 268 | ||||
|
As
at February 28, 2010
|
$ | 9,954 | $ | 88 | ||||
|
Fiscal years ending February 28,
|
|
|||
|
2011
|
$ | 70,000 | ||
|
2012
|
17,500 | |||
| $ | 87,500 | |||
|
7.
|
Accrued
expenses
|
|
February 28,
2010
(’000)
|
February 28,
2009
(’000)
|
|||||||
|
Professional fees
|
$ | 230 | $ | 198 | ||||
|
Interest
expense
|
50 | 21 | ||||||
|
Mail
in rebate provision
|
544 | 529 | ||||||
|
Sales
marketing program
|
741 | 763 | ||||||
|
Employee
related payments
|
522 | 392 | ||||||
|
Product
warranty provision
|
289 | 109 | ||||||
|
Uninvoiced
goods and services
|
1,196 | 1,055 | ||||||
|
Other
liabilities
|
817 | 684 | ||||||
| $ | 4,389 | $ | 3,751 | |||||
|
8.
|
Commitments
and contingencies
|
|
Fiscal
years ending February 28/29
|
(’000)
|
|||
|
2011
|
$ | 668 | ||
|
2012
|
343 | |||
|
2013
|
13 | |||
| $ | 1,024 | |||
|
9.
|
Bank
loan and notes payable
|
|
10.
|
Stockholders’
Equity
|
|
Fiscal Year Ended
|
Fiscal Year Ended
|
Fiscal Year Ended
|
||||||||||
|
February 28, 2010
|
February 28, 2009
|
February 29, 2008
|
||||||||||
|
Shares
outstanding, beginning
|
21,278 | 20,865 | 17,406 | |||||||||
|
Weighted-average
shares issued
|
- | 135 | 2,394 | |||||||||
|
Weighted-average
shares, basic
|
21,278 | 21,000 | 19,800 | |||||||||
|
Effect
of dilutive stock options and warrants
|
- | - | 600 | |||||||||
|
Weighted-average
shares, diluted
|
21,278 | 21,000 | 20,400 | |||||||||
|
Number of
|
Weighted
|
|||||||||||||||||||
|
Shares
|
shares
|
Average
|
||||||||||||||||||
|
available
|
under
|
Exercise
|
Total
|
exercise
|
||||||||||||||||
|
for grant
|
option
|
Price
|
$
|
price
|
||||||||||||||||
|
Balance
at March 1, 2008
|
465,062 | 2,047,663 | $ | 10,065,859 | $ | 4.92 | ||||||||||||||
|
Options
granted (weighted average fair value of $0.37)
|
(525,600 | ) | 525,600 | $ | 0.40-$1.43 | 547,760 | $ | 1.05 | ||||||||||||
|
Options
exercised
|
— | (74,000 | ) | $ | 0.63 | (46,250 | ) | $ | 0.63 | |||||||||||
|
Options
forfeited
|
940,116 | (940,116 | ) | $ | 0.63-$8.53 | (4,912,033 | ) | $ | 5.23 | |||||||||||
|
Balance
at February 28, 2009
|
879,578 | 1,559,147 | $ | 5,655,336 | $ | 3.63 | ||||||||||||||
|
New
authorized
|
2,000,000 | - | - | - | - | |||||||||||||||
|
Options
granted (weighted average fair value of $0.61)
|
(1,630,400 | ) | 1,630,400 | $ | 1.28 | 2,078,760 | $ | 1.28 | ||||||||||||
|
Options
exercised
|
— | — | — | — | — | |||||||||||||||
|
Options
forfeited
|
410,436 | (410,436 | ) | $ | 0.42-$8.28 | 1,611,878 | $ | 3.93 | ||||||||||||
|
Balance
at February 28, 2010
|
1,659,614 | 2,779,111 | $ | 6,122,218 | $ | 2.20 | ||||||||||||||
|
February 28, 2010
|
February 28, 2009
|
|||||||
|
Exercise
price range
|
$ | 0.40-$8.53 | $ | 0.40-$8.53 | ||||
|
Shares
outstanding
|
2,779,111 | 1,559,147 | ||||||
|
Weighted
average exercise price
|
$ | 2.20 | $ | 3.63 | ||||
|
Weighted
average contractual life
|
8.4
years
|
8.0
years
|
||||||
|
Shares
exercisable
|
1,287,695 | 733,929 | ||||||
|
Weighted
average exercise price
|
$ | 2.76 | $ | 3.74 | ||||
|
Weighted
average contractual life
|
7.5
years
|
7.2
years
|
||||||
|
Weighted
|
||||||||||||||||
|
average
|
||||||||||||||||
|
Number
|
Exercise
|
Total
|
exercise
|
|||||||||||||
|
of shares
|
price
|
$
|
price
|
|||||||||||||
|
Balance
at March 1, 2008
|
142,564
|
$
|
2.25-$3.90
|
398,428
|
$
|
2.80
|
||||||||||
|
Warrants
granted
|
—
|
—
|
—
|
—
|
||||||||||||
|
Warrants
exercised
|
—
|
—
|
—
|
—
|
||||||||||||
|
Warrants forfeited
|
—
|
—
|
—
|
—
|
||||||||||||
|
Balance
at February 28, 2009
|
142,564
|
$
|
2.25-$3.90
|
398,428
|
$
|
2.80
|
||||||||||
|
Warrants
granted
|
140,520
|
$ |
5.00
|
702,600
|
5.00
|
|||||||||||
|
Warrants
exercised
|
—
|
—
|
—
|
—
|
||||||||||||
|
Warrants forfeited
|
—
|
—
|
—
|
—
|
||||||||||||
|
Balance
at February 28, 2010
|
283,084
|
$
|
2.25-$5.00
|
$ |
1,101,028
|
$
|
3.89
|
|||||||||
|
11.
|
Employee
savings and retirement plan
|
|
12.
|
Income
taxes
|
|
February 28,
|
February 28,
|
February 29,
|
||||||||||
|
2010
|
2009
|
2008
|
||||||||||
|
(’000)
|
(’000)
|
(’000)
|
||||||||||
|
Domestic
|
$ | (12,826 | ) | $ | (11,091 | ) | $ | 426 | ||||
|
International
|
(709 | ) | (572 | ) | 75 | |||||||
| $ | (13,535 | ) | $ | (11,663 | ) | $ | 501 | |||||
|
February 28,
|
February 28,
|
|||||||
|
|
2010
|
2009
|
||||||
|
|
(’000)
|
(’000)
|
||||||
|
|
||||||||
|
Intangible
assets
|
$
|
162
|
$
|
369
|
||||
|
Temporary
differences of accruals and allowances
|
3,595
|
2,850
|
||||||
|
Stock
based compensation
|
203
|
(81
|
)
|
|||||
|
Net
operating loss carry forwards
|
6,339
|
2,513
|
||||||
|
State
deferred tax effect on federal
|
(474
|
)
|
(318
|
)
|
||||
|
Gross
deferred tax assets
|
9,825
|
5,333
|
||||||
|
Valuation
allowance
|
(8,989
|
)
|
(4,497
|
)
|
||||
|
Net
deferred tax assets
|
$
|
836
|
$
|
836
|
||||
|
Reported
as:
|
||||||||
|
Current
deferred tax assets
|
$
|
836
|
$
|
836
|
||||
|
Non-current
deferred tax assets
|
-
|
-
|
||||||
|
Net
deferred tax assets
|
$
|
836
|
$
|
836
|
||||
|
February 28, 2010
|
February 28, 2009
|
February 29, 2008
|
||||||||||
|
(’000)
|
(’000)
|
(’000)
|
||||||||||
|
Current:
|
||||||||||||
|
Federal
(provision)/benefit
|
$ | — | $ | — | $ | 720 | ||||||
|
State
(provision)/benefit
|
— | — | 216 | |||||||||
|
Foreign
(provision)/benefit
|
1 | (61 | ) | - | ||||||||
| $ | 1 | $ | (61 | ) | $ | 936 | ||||||
|
Fiscal Year Ended
|
||||||||||||
|
February 28, 2010
|
February 28, 2009
|
February 29, 2008
|
||||||||||
|
(%)
|
(%)
|
(%)
|
||||||||||
|
Statutory
federal income tax/(benefit) rate
|
(34 | ) | (34 | ) | 34 | |||||||
|
State
taxes, net of federal tax benefit
|
(5.8 | ) | (5.8 | ) | 5.8 | |||||||
|
Depreciation
& Amortizations
|
(2.0 | ) | 3.1 | - | ||||||||
|
Valuation
allowances
|
5.5 | 22.2 | (25.7 | ) | ||||||||
|
Stock
based compensation
|
1.9 | 3.0 | (81.2 | ) | ||||||||
|
NOL
not utilized (utilized)
|
27.6 | 20.5 | (123.4 | ) | ||||||||
|
Foreign
tax differential
|
— | 0.5 | — | |||||||||
|
Other
– net
|
6.8 | (9.0 | ) | 3.7 | ||||||||
|
Effective
tax rate
|
— | % | 0.5 | % | (186.8 | )% | ||||||
|
13.
|
Segment
and geographic information
|
|
Fiscal Year Ended
|
||||||||||||
|
February 28, 2010
|
February 28, 2009
|
February 29, 2008
|
||||||||||
|
(’000)
|
(’000)
|
(’000)
|
||||||||||
|
Memory
processing
|
$ | 72,830 | $ | 100,956 | $ | 95,290 | ||||||
|
SSD/Flash
memory storage
|
49,611 | 29,635 | 6,292 | |||||||||
|
Power
supplies
|
21,518 | 25,391 | 16,770 | |||||||||
|
Total
|
$ | 143,959 | $ | 155,982 | $ | 118,352 | ||||||
|
Fiscal Year Ended
|
||||||||||||
|
February 28, 2010
|
February 28, 2009
|
February 29, 2008
|
||||||||||
|
($’000)
|
(’000)
|
(’000)
|
||||||||||
|
United
States
|
$ | 62,489 | $ | 60,428 | $ | 44,030 | ||||||
|
Canada
|
7,667 | 10,508 | 11,260 | |||||||||
|
Europe/Middle
East/Africa
|
56,535 | 74,699 | 57,500 | |||||||||
|
Rest
of World
|
17,268 | 10,347 | 5,562 | |||||||||
|
Total
|
$ | 143,959 | $ | 155,982 | $ | 118,352 | ||||||
|
14.
|
Accounts
receivable allowances
|
|
($’000)
|
Beginning
Balance of
Doubtful
Accounts
|
Additions
Charged to
Expense or
Other Accounts
|
Write-offs
|
Ending
Balance of
Doubtful
Accounts
|
Ending
Balance of
Other
Allowances
|
Total
Allowances for
Accounts
Receivable
|
||||||||||||||||||
|
Periods Ended:
|
||||||||||||||||||||||||
|
Fiscal year
ended February 29, 2008
|
$ | 473 | $ | 299 | $ | (510 | ) | $ | 262 | $ | 254 | $ | 516 | |||||||||||
|
Fiscal
year ended February 28, 2009
|
$ | 262 | $ | 1,410 | (635 | ) | $ | 1,037 | $ | 1,242 | $ | 2,279 | ||||||||||||
|
Fiscal
year ended February 28, 2010
|
$ | 1,037 | $ | 644 | $ | (35 | ) | $ | 1,646 | $ | 1,207 | $ | 2,853 | |||||||||||
|
15.
|
Supplementary
Financial Information – Quarterly Financial Data
(unaudited)
|
|
February 28, 2010
|
February 28, 2009
|
February 29, 2008
|
||||||||||||||||||||||||||||||||||||||
|
Q4
|
Q3
|
Q2
|
Q1
|
Q4
|
Q3
|
Q2
|
Q1
|
Q4
|
Q3
|
|||||||||||||||||||||||||||||||
|
Feb 28
|
Nov 30
|
Aug 31
|
May 31
|
Feb 28
|
Nov 30
|
Aug 31
|
May 31
|
Feb 29
|
Nov 30
|
|||||||||||||||||||||||||||||||
|
Net
revenues
|
$ | 32,369 | $ | 38,024 | $ | 37,795 | $ | 35,771 | $ | 41,119 | $ | 35,230 | $ | 41,859 | $ | 37,774 | $ | 33,679 | $ | 33,346 | ||||||||||||||||||||
|
Gross
profit
|
2,243 | 6,457 | 6,261 | 3,695 | 6,750 | 338 | 5,905 | 6,798 | 6,839 | 5,217 | ||||||||||||||||||||||||||||||
|
Operating
profit/(loss)
|
(5,995 | ) | (1,050 | ) | (1,301 | ) | (4,200 | ) | (373 | ) | (9,046 | ) | (1,625 | ) | 150 | (120 | ) | (350 | ) | |||||||||||||||||||||
|
Earnings
(loss) per share – basic
|
$ | (0.31 | ) | $ | (0.05 | ) | $ | (0.08 | ) | $ | (0.20 | ) | $ | (0.03 | ) | $ | (0.46 | ) | $ | (0.07 | ) | $ | 0.00 | $ | 0.01 | $ | 0.03 | |||||||||||||
|
Earnings
(loss) per share - diluted
|
$ | (0.31 | ) | $ | (0.05 | ) | $ | (0.08 | ) | $ | (0.20 | ) | $ | (0.03 | ) | $ | (0.46 | ) | $ | (0.07 | ) | $ | 0.00 | $ | 0.01 | $ | 0.03 | |||||||||||||
|
16.
|
Subsequent
Events
|
|
Item
9.
|
Changes
in and Disagreements with Accountants on Accounting and Financial
Disclosure
|
|
Item
9A(t).
|
Controls
and Procedures
|
|
Item
9B.
|
Other
Information
|
|
Item
10.
|
Directors,
Executive Officers and Corporate
Governance
|
|
Name
|
Age
|
Position(s)
|
Director/Officer
Since
|
|||
|
Ryan
M. Petersen
|
35
|
Chief
Executive Officer and Director
|
2002
|
|||
|
Kerry
T. Smith
|
48
|
Chief
Financial Officer and Director
|
2009
|
|||
|
Alex
Mei
|
34
|
Executive
Vice President, Chief Marketing Officer
|
2004
|
|||
|
Justin
Shong
|
42
|
Senior
Vice President of Sales
|
2007
|
|||
|
Adam
Epstein
|
44
|
Director
|
2010
|
|||
|
Richard
L. Hunter
|
57
|
Director
|
2010
|
|||
|
Sunit
Saxena1
|
|
51
|
|
Director
|
|
2010
|
|
Director
|
Term Expires at the
Annual Meeting of
Stockholders in:
|
Audit
Committee
|
Compensation
Committee
|
Nominating and
Governance
Committee
|
||||
|
Ryan
M. Petersen
|
2010
|
|||||||
|
Kerry
T. Smith
|
2011
|
|||||||
|
Adam
Epstein
|
2011
|
Member
|
Member
|
Chairman
|
||||
|
Richard
L. Hunter
|
2012
|
Member
|
Chairman
|
Member
|
|
|
§
|
oversee
the work of our independent
auditors;
|
|
|
§
|
approve
the hiring, discharging and compensation of our independent
auditors;
|
|
|
§
|
review
the qualifications and independence of our independent auditors; monitor
the rotation of partners of the independent auditors on our engagement
team as required by law;
|
|
|
§
|
review
our financial statements and review our critical accounting policies and
estimates;
|
|
|
§
|
review
the adequacy and effectiveness of our internal control policies and
procedures;
|
|
|
§
|
review
and discuss with management and the independent auditors the results of
our annual audits, our quarterly financial statements and our publicly
filed reports; and
|
|
|
§
|
prepare
our Audit Committee report if required by any government
agency.
|
|
|
§
|
reviewing
and approving compensation of our executive officers, including their
annual base salary, annual incentive bonuses, equity compensation,
employment agreements, severance and change in control arrangements, and
any other benefits, compensations or
arrangements;
|
|
|
§
|
reviewing
and approving corporate goals and objectives relevant to compensation of
the chief executive officer and other executive
officers;
|
|
|
§
|
evaluating
the performance of the chief executive officer and other executive
officers in light of those goals and
objectives;
|
|
|
§
|
setting
compensation of the chief executive officer and other executive
officers;
|
|
|
§
|
administering
the issuance of stock options and other awards to executive officers and
directors under our stock plan;
|
|
|
§
|
reviewing
and evaluating, at least annually, the performance of the Compensation
Committee and its members, including compliance of the Compensation
Committee with its charter; and
|
|
|
§
|
preparing
the Compensation Committee report if required by any government
agency.
|
|
|
§
|
evaluate
and select, or recommend to the Board, nominees for each election of
directors, except that if we are at any time legally required by contract
or otherwise to provide any third party with the ability to nominate a
director, the Committee need not evaluate or propose such nomination,
unless required by contract or requested by the
Board;
|
|
|
§
|
determine
criteria for selecting new directors, including desired board skills and
attributes, and identify and actively seek individuals qualified to become
directors;
|
|
|
§
|
consider
any nominations of director candidates validly made by our
stockholders;
|
|
|
§
|
review
and make recommendations to the Board concerning qualifications,
appointment and removal of committee
members;
|
|
|
§
|
review
and make recommendations to the Board concerning Board and committee
compensation;
|
|
|
§
|
develop,
recommend for Board approval, and review on an ongoing basis the adequacy
of, the corporate governance principles applicable to
us;
|
|
|
§
|
in
consultation with the Audit Committee, consider and present to the Board
for adoption a Code of Conduct and Business Ethics applicable to all
employees, officers and directors, which meets the requirements of Item
406 of the SEC’s Regulation S-K, and provide for and review prompt
disclosure to the public of any change in, or waiver of, such Code of
Conduct;
|
|
|
§
|
review,
at least annually, our compliance with The NASDAQ Capital Market corporate
governance listing requirements, and report to the Board regarding the
same;
|
|
|
§
|
assist
the Board in developing criteria for the evaluation of Board and committee
performance;
|
|
|
§
|
evaluate
the Committee’s own performance on an annual
basis;
|
|
|
§
|
if
requested by the Board, assist the Board in its evaluation of the
performance of the Board and each committee of the
Board;
|
|
|
§
|
review
and recommend to the Board changes to our bylaws as
needed;
|
|
|
§
|
develop
orientation materials for new directors and corporate governance-related
continuing education for all Board members;
and
|
|
|
§
|
make
reports to the Board regarding the foregoing as
appropriate.
|
|
Item
11.
|
Executive
Compensation
|
|
|
§
|
Ryan
M. Petersen, President and Chief Executive
Officer
|
|
|
§
|
Kerry
T. Smith, Chief Financial Officer(1)
|
|
|
§
|
Arthur
Knapp, former Chief Financial Officer(2)
|
|
|
§
|
Alex
Mei, Chief Marketing Officer
|
|
|
§
|
Justin
Shong, Senior Vice President of Global
Sales
|
|
|
(1)
|
Mr.
Smith became our Chief Financial Officer in March 2009. From January
1, 2009 to March 2009, Mr. Smith was our Executive Vice President and
General Counsel.
|
|
|
(2)
|
Mr.
Knapp resigned as our Chief Financial Officer in March
2009.
|
|
|
§
|
attract
and retain talented and experienced
executives;
|
|
|
§
|
motivate
and reward executives whose knowledge, skills and performance are critical
to our success;
|
|
|
§
|
align
the interests of our executive officers and stockholders by motivating
executive officers to increase stockholder value and rewarding executive
officers when stockholder value
increases;
|
|
|
§
|
compensate
our executives to manage our business to meet our long-range objectives;
and
|
|
|
§
|
ensure
that total compensation is fair, reasonable and
competitive.
|
|
|
§
|
base
salaries, which are designed to allow us to attract and retain qualified
candidates in a highly competitive
market;
|
|
|
§
|
variable
compensation, which provides additional cash compensation and is designed
to support our pay-for-performance
philosophy;
|
|
|
§
|
equity
compensation, principally in the form of stock options, which are granted
to incentivize executive behavior that results in increased stockholder
value;
|
|
|
§
|
a
benefits package that is available to all of our employees;
and
|
|
|
§
|
post-termination
compensation.
|
|
|
§
|
Staktek
Holdings, Inc.
|
|
|
§
|
Mindspeed
Technologies, Inc.
|
|
|
§
|
STEC,
Inc.
|
|
|
§
|
Silicon
Storage Technology, Inc.
|
|
Name
|
2008 Base
Salary
|
2009 Base
Salary
|
$ Increase
(2008 to
2009)
|
% Increase
(2008 to
2009)
|
2010 Base
Salary
|
$ Increase
(2009 to
2010)
|
% Increase
(2009 to
2010)
|
||||||||||||||||||||||
|
Ryan
M. Petersen
|
$ | 250,000 | $ | 325,000 | $ | 75,000 | 30 | % | $ | 325,000 | $ | - | - | % | |||||||||||||||
|
Kerry
T. Smith
|
$ | - | $ | 400,000 | $ | - | - | % | $ | 400,000 | $ | - | - | % | |||||||||||||||
|
Arthur
Knapp
|
$ | 150,000 | $ | 205,000 | $ | 55,000 | 37 | % | $ | 205,000 | $ | - | - | % | |||||||||||||||
|
Alex
Mei
|
$ | 155,000 | $ | 205,000 | $ | 50,000 | 32 | % | $ | 205,000 | $ | - | - | % | |||||||||||||||
|
Justin
Shong
|
$ | 165,000 | $ | 165,000 | $ | - | - | % | $ | 165,000 | $ | - | - | % | |||||||||||||||
|
Option Awards (1)
|
|||||||||||||||||||
|
Name
|
Number of
Securities
Underlying
Unexercised
Options (#)
Exercisable
|
Number of Securities
Underlying Unexercised
Options (#)
Unexercisable
|
Equity Incentive
Plan Awards:
Number of
Securities
Underlying
Unexercised
Unearned
Options (#)
|
Options Exercise
Price ($)
|
Option
Expiration
Date
|
||||||||||||||
|
Ryan
M. Petersen
Chief
Executive Officer
|
- | - | - | - |
-
|
||||||||||||||
|
Kerry T. Smith(2)
Chief
Financial Officer
|
200,000 | - | - | $ | 1.28 |
09/17/19
|
|||||||||||||
|
Alex
Mei
Chief
Marketing Officer
|
216,750 | 103,250 | - | $ | 4.42 |
09/17/19
|
|||||||||||||
|
Arthur Knapp(3)
Former
Chief Financial Officer
|
- | - | - | $ | - |
-
|
|||||||||||||
|
Justin
Shong
Sr.
VP of Global Sales
|
48,889 | 71,111 | - | $ | 2.09 |
09/17/09
|
|||||||||||||
|
|
(1)
|
Unless
otherwise noted, all option grants are immediately exercisable, subject to
our right to repurchase shares upon termination of employment or other
service which right lapses in accordance with the vesting schedule of the
option. These figures have been adjusted to reflect the 1 for 2.5
reverse stock split that took place in September
2009.
|
|
|
(2)
|
Mr.
Smith became our Chief Financial Officer in March 2009.
Mr. Smith was issued options to purchase 200,000 shares of fully
vested common stock in September
2009.
|
|
|
(3)
|
Mr.
Knapp resigned as our Chief Financial Officer in March
2009.
|
|
Name and
Principal
Position
|
Fiscal Year
Ended
|
Salary ($)
|
Bonus
($)(1)
|
Stock
Awards
($)
|
Option
Awards
($)(2)
|
Non-Equity
Incentive Plan
Compensation
($)
|
All Other
Compensation
($)
|
Total ($)
|
||||||||||||||||||||||
|
Ryan
M. Petersen
|
Feb.
29, 2008
|
$ | 250,000 | $ |
3,000
|
- | - | - | - | $ | 253,000 | |||||||||||||||||||
|
Chief
Executive
|
Feb.
28, 2009
|
$ | 325,000 | - | - | - | - | - | $ | 325,000 | ||||||||||||||||||||
|
Officer
|
Feb.
28, 2010
|
$ | 325,000 | - | - | - | - | - | $ | 325,000 | ||||||||||||||||||||
|
Kerry T. Smith(3)
|
Feb.
29, 2008
|
- | - | - | - | - | - | - | ||||||||||||||||||||||
|
Chief
Financial
|
Feb.
28, 2009
|
$ | 66,666 | - | - | $ | 121,060 | - | - | $ | 187,726 | |||||||||||||||||||
|
Officer
|
Feb.
28, 2010
|
$ | 400,000 | - | - | - | - | - | $ | 400,000 | ||||||||||||||||||||
|
Alex
Mei
|
Feb.
29, 2008
|
$ | 155,000 | $ | 106,000 | (4) | - | $ | 84,616 | - | - | $ | 345,616 | |||||||||||||||||
|
Chief
Marketing
|
Feb.
28, 2009
|
$ | 205,000 | - | - | $ | 124,100 | - | - | $ | 329,100 | |||||||||||||||||||
|
Officer
|
Feb.
28, 2010
|
$ | 205,000 | - | - | $ | 108,408 | - | - | $ | 313,408 | |||||||||||||||||||
|
Arthur Knapp(5)
|
Feb.
29, 2008
|
$ | 150,000 | $ | 4,500 | - | $ | 61,358 | - | - | $ | 215,858 | ||||||||||||||||||
|
Former
Chief
|
Feb.
28, 2009
|
$ | 205,000 | - | - | $ | 83,600 | - | - | $ | 288,600 | |||||||||||||||||||
|
Financial
Officer
|
Feb.
28, 2010
|
- | - | - | - | - | - | - | ||||||||||||||||||||||
|
Justin
Shong
|
Feb.
29, 2008
|
$ | 43,150 | $ | 8,750 | - | $ | 4,600 | - | - | $ | 56,500 | ||||||||||||||||||
|
Sr.
VP of Global
|
Feb.
28, 2009
|
$ | 165,000 | $ | 89,882 | - | $ | 18,500 | - | - | $ | 273,382 | ||||||||||||||||||
|
Sales
|
Feb.
28, 2010
|
$ | 165,000 | $ | 79,172 | - | $ | 21,179 | - | - | $ | 265,351 | ||||||||||||||||||
|
|
(1)
|
From
time to time, the Board will review quarterly results and, based on those
results, will determine whether employees are entitled to receive
bonuses. Historically, the Board has not set pre-established targets
for bonuses.
|
|
|
(2)
|
An
Option award values reflect the grant date fair value of awards computed
in accordance with stock-based accounting rules (FASB ASC topic
718). See Stock
Based Compensation in the “Management’s Discussion
and Analysis of
Financial
Condition and Results of Operations” for
a discussion of assumptions made in determining the grant date fair value
and compensation expense of our stock
options.
|
|
|
(3)
|
Mr.
Smith joined us as our Senior Vice President and General Counsel on
January 1, 2009 at a base salary of $400,000 with a guaranteed bonus of
$100,000 and an additional bonus of $120,000 worth of fully vested common
stock. In March 2009, Mr. Smith became our Chief Financial
Officer. Mr. Smith agreed to take an option for 200,000 fully
vested shares in lieu of receiving a bonus of
$120,000.
|
|
|
(4)
|
Represents
$6,000 discretionary bonus and $100,000 to recognize successful marketing
and branding efforts.
|
|
|
(5)
|
Mr.
Knapp resigned as our Chief Financial Officer in March
2009.
|
|
Option Awards(1)
|
|||||||||||||||||||
|
Name
|
Number of
Securities
Underlying
Unexercised
Options (#)
Exercisable
|
Number of Securities
Underlying Unexercised
Options (#)
Unexercisable
|
Equity Incentive
Plan Awards:
Number of
Securities
Underlying
Unexercised
Unearned
Options (#)
|
Options Exercise
Price ($)
|
Option
Expiration
Date
|
||||||||||||||
|
Ryan
M. Petersen
|
- | - | - | - |
-
|
||||||||||||||
|
Chief
Executive Officer
|
|||||||||||||||||||
|
Kerry T. Smith(2)
|
200,000 | - | - | $ | 1.28 |
09/17/19
|
|||||||||||||
|
Chief
Financial Officer
|
|||||||||||||||||||
|
Alex
Mei
|
216,750 | 103,250 | - | $ | 4.42 |
09/17/19
|
|||||||||||||
|
Chief
Marketing Officer
|
|||||||||||||||||||
|
Arthur Knapp(3)
|
- | - | - | $ | - |
-
|
|||||||||||||
|
Former
Chief Financial Officer
|
|||||||||||||||||||
|
Justin
Shong
|
48,889 | 71,111 | - | $ | 2.09 |
09/17/09
|
|||||||||||||
|
Sr.
VP of Global Sales
|
|||||||||||||||||||
|
|
(1)
|
Unless
otherwise noted, all option grants are immediately exercisable, subject to
our right to repurchase shares upon termination of employment or other
service which right lapses in accordance with the vesting schedule of the
option.
|
|
|
(2)
|
Mr. Smith
was issued options to purchase 200,000 shares of fully vested common stock
in September 2009.
|
|
|
(3)
|
Mr.
Knapp resigned as our Chief Financial Officer in March
2009.
|
|
Name(1)
|
Fees Earned or
Paid in Cash ($)
|
Stock
Awards ($)
|
Option
Awards
($)(2)
|
Non-Equity
Incentive Plan
Compensation
|
Change in
Pension Value
and
Nonqualified
Deferred
Compensation
Earnings
|
All Other
Compensation
($)
|
Total ($)
|
|||||||||||||||||||||
|
George Kynoch(3)
|
$ | 52,500 | - | $ | 15,731 | - | - | - | $ | 68,231 | ||||||||||||||||||
|
Quentin Solt(4)
|
$ | 78,600 | - | $ | 30,294 | - | - | - | $ | 108,894 | ||||||||||||||||||
|
|
(1)
|
See
the Summary Compensation Table for disclosure related to Ryan M. Petersen
and Kerry T. Smith, who are our Chief Executive Officer and Chief
Financial Officer, respectively. Messrs. Petersen and Smith, as
employee directors, did not receive any additional compensation for their
services as members of our Board.
|
|
|
(2)
|
Option
award values reflect the grant date fair value of awards computed in
accordance with stock-based accounting rules (FASB ASC topic 718).
See Note 2 of Notes to Consolidated Financial Statements for a discussion
of valuation assumptions made in determining the grant date fair value and
compensation expense of our stock
options.
|
|
|
(3)
|
George
Kynoch had a written consulting agreement with OCZ in connection with his
position as a director. The consulting agreement provided for
compensation of £40,000 (approximately $60,000) per year for his service
as a member of the Board, a member of each of the Compensation and Audit
Committees, Chairman of the Board and Chairman of the Audit
Committee. The Board subsequently increased Mr. Kynoch’s
compensation to £54,000 (approximately $81,000) per year. If
Mr. Kynoch’s services to OCZ exceeded an aggregate of three days in
any single month, then he would have received £1,000 (approximately
$1,500) per eight hours of service to the Board. In connection with
his services on the Board, Mr. Kynoch received options to purchase 60,000
shares of our common stock. Mr. Kynoch resigned from all
positions with OCZ in
July 2009.
|
|
|
(4)
|
Quentin
Solt had a written consulting agreement with OCZ in connection with his
position as a director. The consulting agreement provided for
compensation of £25,000 (approximately $37,500) per year for his service
as a member of the Board, a member of each of the Compensation and Audit
Committees and Chairman of the Compensation Committee. The
Board subsequently increased Mr. Solt’s compensation to £36,000
(approximately $54,000) per year. If Mr. Solt’s services to OCZ
exceeded an aggregate of three days in any single month, then he would
have received £1,000 (approximately $1,500) per eight hours of service to
the Board. In connection with his services on the Board, Mr.
Solt received options to purchase 60,000 shares of our common
stock. Mr. Solt resigned from all positions with OCZ in January
2010 resulting in forfeiture of all of his then outstanding vested options
because they were not subsequently exercised within the prescribed 90 day
period.
|
|
Item
12.
|
Security
Ownership of Certain Beneficial Owners and Management and Related
Stockholder Matters
|
|
Name and Address of Beneficial Owner(1)
|
Number of Shares
Beneficially Owned(2)
|
Percent(3)
|
||||||
|
CIM
Investment Management Limited(4)
British
Columbia House
1
Regent Street
London
SW1Y 4NS
United
Kingdom
|
1,355,000 | 5.12 | % | |||||
|
Arthur
Armagast(5)
|
4,068,800 | 15.38 | % | |||||
|
Ryan
M. Petersen(6)
|
4,996,348 | 18.88 | % | |||||
|
Kerry
T. Smith(7)
|
207,015 | * | % | |||||
|
Alex
Mei(8)
|
350,000 | 1.31 | % | |||||
|
Arthur
Knapp
|
447,117 | 1.69 | % | |||||
|
Justin
Shong(9)
|
120,000 | * | % | |||||
|
Quentin
Solt
|
160,458 | * | % | |||||
|
George
Kynoch
|
9,200 | * | % | |||||
|
Adam
Epstein(10)
|
159,998 | * | % | |||||
|
Richard
L. Hunter(11)
|
110,000 | * | % | |||||
|
Sunit
Saxena(12)
|
110,000 | * | % | |||||
|
Directors
and executive officers as a group (10 persons)(13)
|
6,670,136 | 24.30 | % | |||||
|
|
*
|
Represents
less than 1% of the issued and outstanding shares of our common stock as
of April 30, 2010.
|
|
|
(1)
|
Except
as otherwise indicated, the persons named in this table have sole voting
and investment power with respect to all shares of common stock shown as
beneficially owned by them, subject to community property laws where
applicable and to the information contained in the footnotes to this
table.
|
|
|
(2)
|
Under
the rules of the Securities and Exchange Commission, a person is deemed to
be the beneficial owner of shares that can be acquired by such person
within 60 days upon the exercise of their options. Except
as otherwise noted, options granted under our Stock Incentive Plan are
immediately exercisable, subject our right to repurchase unvested shares
upon termination of employment or other service at a price equal to the
option exercise price.
|
|
|
(3)
|
Calculated
on the basis of 26,460,015 shares of common stock outstanding as of
April 30, 2010 provided that any additional shares of common stock that a
stockholder has the right to acquire within 60 days after the date of
this filing are deemed to be outstanding for the purpose of calculating
that stockholder’s percentage beneficial
ownership.
|
|
|
(4)
|
CIM
Investment Management Limited has sole voting and dispositive power with
respect to these shares, as set forth in Schedule 13G filed with the SEC
on April 9, 2010.
|
|
|
(5)
|
Includes
2,400,000 shares held by Pearl Investments LLC. Mr. Armagast
has sole voting and dispositive power with respect to these
shares. Also includes 1,468,800 shares held by The Arthur P.
Armagast Trust and 200,000 shares held by The Christine Armagast Trust
and of which
Mr. Armagast disclaims any interest. Mr. Armagast is the
trustee of both trusts.
|
|
|
(6)
|
All
of the shares are held by the Petersen Family Trust. Mr.
Petersen, as trustee of these trusts, has voting and dispositive power
over these securities.
|
|
|
(7)
|
Mr.
Smith is entitled to purchase 200,000 shares of our common stock, in
addition to the 7,015 which he currently
owns.
|
|
|
(8)
|
Includes
320,000 shares subject to immediately exercisable options, of which
233,000 shares will be vested within 60 days of April 30,
2010.
|
|
|
(9)
|
Includes
120,000 shares subject to immediately exercisable options, of which 61,666
shares will be vested within 60 days of April 30,
2010.
|
|
|
(10)
|
Includes
(i) immediately exercisable warrants to purchase 16,666 shares of our
common stock and (ii) 110,000 shares subject to immediately exercisable
options, of which 9,166 shares will be vested within 60 days of April 30,
2010.
|
|
|
(11)
|
Includes
110,000 shares subject to immediately exercisable options, of which 9,166
shares will be vested within 60 days of April 30,
2010.
|
|
|
(12)
|
Includes
110,000 shares subject to immediately exercisable options, of which 3,055
shares were vested as of his resignation on May 6, 2010. No
additional shares will be vested within 60 days of April 30,
2010.
|
|
|
(13)
|
See
notes 6 through 12. Includes 986,666 shares subject to
options and warrants that are currently exercisable or will become
exercisable within 60 days of April 30, 2010 that are beneficially owned
by executive officers and
directors.
|
|
Item 13.
|
Certain
Relationships and Related Transactions, and Director
Independence
|
|
Item 14.
|
Principal
Accounting Fees and Services
|
|
Fiscal Year
Ended February
28, 2010
|
Fiscal Year
Ended February
28, 2009
|
|||||||
|
Audit
fees
|
$ | 125,259 | $ | 208,074 | ||||
|
Audit
related fees
|
$ | 26,372 | $ | 1,256 | ||||
|
Tax
fees
|
$ | - | $ | - | ||||
|
All
other fees
|
$ | 9,015 | $ | 37,180 | ||||
| $ | 160,646 | $ | 246,510 | |||||
|
Item 15.
|
Exhibits,
Financial Statement Schedules
|
|
|
1.
|
Financial
Statements
|
|
|
2.
|
Financial
Statement Schedules
|
|
|
3.
|
Exhibits
|
|
OCZ
Technology Group, Inc.
|
|
|
By:
|
/s/
Ryan M. Petersen
|
|
Ryan
M. Petersen
|
|
|
President
and Chief Executive Officer
|
|
|
By:
|
/s/ Kerry T. Smith |
|
Kerry
T. Smith
|
|
|
Chief
Financial Officer
|
|
Name
|
Title
|
Date
|
||
| /s/ Ryan M. Petersen |
Chief
Executive Officer and Director
|
May
20, 2010
|
||
|
Ryan
M. Petersen
|
(Principal
Executive Officer)
|
|||
|
Chief
Financial Officer and Director
|
May
20, 2010
|
|||
| /s/ Kerry T. Smith |
(Principal
Financial and Accounting Officer)
|
|||
|
Kerry
T. Smith
|
||||
| /s/ Adam Epstein |
Director
|
May
20, 2010
|
||
|
Adam
Epstein
|
||||
| /s/ Richard L. Hunter |
Director
|
May
20, 2010
|
||
|
Richard
L. Hunter
|
|
Exhibit
No.
|
Description
|
|
|
2.1
|
Agreement
and Plan of Merger dated December 17, 2004 of OCZ Technology Group,
Inc., an Indiana corporation, with and into OCZ Technology Group, Inc., a
Delaware corporation. (1)
|
|
|
2.2
|
Asset
Purchase Agreement dated May 25, 2007 by and among OCZ Technology
Group, Inc., PC Power and Cooling, Inc. and Douglas Dodson. (1)
|
|
|
2.3
|
Asset
Purchase Agreement dated October 25, 2007 by and among OCZ Technology
Group, Inc., Silicon Data Inc., a New York corporation, Fred Cohen, and
Eyal Akler. (1)
|
|
|
3.1
|
Fourth
Amended and Restated Certificate of Incorporation as filed with the
Delaware Secretary of State on September 30, 2009.
(1)
|
|
|
3.2
|
Fourth
Amended and Restated Bylaws. (1)
|
|
|
3.3
|
Certificate
of Designation as filed with the Delaware Secretary of State on November
4, 2009. (4)
|
|
|
4.1
|
Specimen
common stock certificate of OCZ Technology Group, Inc. (1)
|
|
|
10.1
|
OCZ
Technology Group, Inc. 2004 Stock Incentive Plan.
(1)
|
|
|
10.2
|
Executive
Employment Agreement dated April 4, 2006 by and between OCZ
Technology Group, Inc. and Ryan M. Petersen.
(1)
|
|
|
10.3
|
Executive
Employment Agreement dated April 4, 2006 by and between OCZ
Technology Group, Inc. and Arthur Knapp.
(1)
|
|
|
10.4
|
Executive
Employment Agreement dated April 4, 2006 by and between OCZ
Technology Group, Inc. and Alex Mei.
(1)
|
|
|
10.5
|
Executive
Employment Agreement dated December 17, 2008 by and between OCZ
Technology Group, Inc. and Kerry Smith.
(1)
|
|
|
10.6
|
Offer
Letter dated June 13, 2006 memorializing the terms of Mr. George
Kynoch’s services as a non-executive director. (1)
|
|
|
10.7
|
Offer
Letter dated June 13, 2006 memorializing the terms of
Mr. Quentin Colin Maxwell Solt’s services as a non-executive
director.
(1)
|
|
|
10.8
|
Sub-Sublease
dated January 30, 2009 by and between Oracle USA, Inc. and OCZ
Technology Group, Inc. for the property located in San Jose, California,
USA. (1)
|
|
|
10.9
|
Lease
dated April 21, 2005 by and between Buckgolf Inc., & Greengolf
Inc. and OCZ Technology Group, Inc. dated for the property located in
Markham, Ontario, Canada. (1)
|
|
|
10.10
|
English
translation of lease dated August 7, 2005 by and between Vrodest
Delft C.V. and OCZ Technology Group, Inc. for the property located in
Delft, The Netherlands. (1)
|
|
|
10.11
|
English
summary of lease for the property located in Taipei County, Taiwan. (1)
|
|
|
10.12
|
English
summary of lease for the property located in Lujhu Township, Taiwan. (1)
|
|
10.13
|
Form
of Indemnification Agreement for Directors and Officers of OCZ Technology
Group, Inc. (1)
|
|
|
10.14
|
Executive
Employment Agreement dated November 30, 2007 by and between OCZ
Technology Group, Inc. and Justin Shong.
(1)
|
|
|
10.15
|
Loan
and Security Agreement dated July 2009 by and between OCZ Technology
Group, Inc. and Silicon Valley Bank. (1)
|
|
|
10.16
|
Sale
of Accounts and Security Agreement by and between OCZ Technology Group,
Inc. and Faunus Group International, Inc. dated July 6, 2009. (1)
|
|
|
10.17
|
Asset
Purchase Agreement dated August 31, 2009, by and between OCZ
Technology Group, Inc. and BCInet, Inc. (1)
|
|
|
10.18
|
Secured
Promissory Note, dated August 31, 2009, issued by BCInet, Inc. to OCZ
Technology Group, Inc. in the amount of $311,215. (1)
|
|
|
10.19
|
Secured
Promissory Note, dated August 31, 2009, issued by BCInet, Inc. to OCZ
Technology Group, Inc. in the amount of $170,000. (1)
|
|
|
10.20
|
Secured
Convertible Promissory Note, dated August 31, 2009, issued by BCInet,
Inc. to OCZ Technology Group, Inc. in the amount of $414,200. (1)
|
|
|
10.21
|
Series A
Preferred Stock Purchase Agreement dated August 31, 2009 by and
between BCInet, Inc. and OCZ Technology Group, Inc. (1)
|
|
|
10.22
|
Security
Agreement dated August 31, 2009 by and between BCI net, Inc. and OCZ
Technology Group, Inc.
(2).
|
|
|
10.23
|
Confidential
Resignation and Consulting Agreement and General Release dated March 12,
2009 by and between OCZ Technology Group, Inc. and Arthur Knapp. (3)
|
|
|
10.24
|
Promissory
Note dated August 19, 2009 from OCZ Technology Group, Inc. to The Ryan
Petersen and Sarita Nuez Family Trust. (3)
|
|
|
10.25
|
Distribution
Agreement June 2009, by and between OCZ Technology Group, Inc.
and Bell Microproducts Canada. (5)
|
|
|
10.26
|
Securities
Purchase Agreement dated March 23, 2010 by and among OCZ Technology Group,
Inc. and the institutional and accredited investors listed therein (6)
|
|
|
10.27
|
Registration
Rights Agreement dated March 23, 2010 by and among OCZ Technology Group,
Inc. and the Purchasers (as defined therein). (6)
|
|
|
10.28
|
Form
of Warrant for the institutional and accredited investors. (6)
|
|
|
10.29
|
Form
of Warrant for Placement Agent (as defined therein). (6)
|
|
|
10.30
|
Second
Amendment to the Loan and Security Agreement dated May 10, 2010 by and
between OCZ Technology Group, Inc. and Silicon Valley Bank. (8)
|
|
|
10.31
|
Offer
Letter dated December 30, 2009 memorializing the terms of Mr. Adam
Epstein’s services as a non-executive director. (9)
|
|
|
10.32
|
Offer
Letter dated December 30, 2009 memorializing the terms of Mr. Richard
L. Hunter’s services as a non-executive director. (9)
|
|
10.33
|
Offer
Letter dated December 30, 2009 memorializing the terms of Mr. Sunit
Saxena’s services as a non-executive director. (9)
|
|
|
14.1
|
Code
of Ethics. (9)
|
|
|
16.1
|
Letter
regarding change in certifying accountants dated April 5, 2010 from
Horwath Clark Whitehill. (7)
|
|
|
21.1
|
Subsidiaries
of OCZ Technology Group, Inc. (1)
|
|
|
23.1
|
Consent
of Independent Certified Public Accountant – Crowe Horwath, LLP. (9)
|
|
|
23.2
|
Consent
of Independent Certified Public Accountant – Horwath Clark Whitehill, LLP.
(9)
|
|
|
31.1
|
Chief
Executive Officer’s Certification required by Rule 13(a)-14(a). (9)
|
|
|
31.2
|
Chief
Financial Officer’s Certification required by Rule 13(a)-14(a). (9)
|
|
|
32.1
|
Chief
Executive Officer and Chief Financial Officer Certification pursuant to 18
U.S.C. 1350, as adopted to section 906 of the Sarbanes-Oxley Act of 2002.
(9)
|
|
|
(1)
|
Incorporated
by reference to exhibit of the same number to the Registrant’s Form 10
filed on September 30,
2009.
|
|
(2)
|
Incorporated
by reference to exhibit of the same number to the Registrant’s Form 10
filed on November 12, 2009.
|
|
(3)
|
Incorporated
by reference to exhibit of the same number to the Registrant’s Form 10
filed on December 4, 2009.
|
|
(4)
|
Incorporated
by reference to Exhibit 3.1 to the Registrant’s Form 10-Q filed on January
14, 2010.
|
|
(5)
|
Incorporated
by reference to Exhibit 99.2 to the Registrant’s Form 8-K filed on January
25, 2010.
|
|
(6)
|
Incorporated
by reference Registrant’s Form 8-K filed on March 26,
2010.
|
|
(7)
|
Incorporated
by reference to Exhibit 16.1 to the Registrant’s Form 8-K filed on April
8, 2010.
|
|
(8)
|
Incorporated
by reference to Exhibit 99.1 to the Registrant’s Form 8-K filed on May 11,
2010.
|
|
(9)
|
Filed
herewith.
|